
Pricing in the airline industry is often compared to a brain game between carriers and passengers where each party pursues the best rates. Carriers love selling tickets at the highest price possible — while still not losing consumers to competitors. Passengers are crazy about buying flights at the lowest cost available — while not missing the chance to get on board. All this makes flight prices fluctuant and hard to predict. But nothing is impossible for people armed with intellect and algorithms.

How dynamic pricing in the airline industry works.
Read on to know how to approach the airfare prediction problem and what we learned from our experience building a price forecasting feature for US-based online travel agency Fareboom.Airfare price forecast: use cases and challenges
There are two main use cases of flight price prediction in the travel industry. OTAs and other travel platforms integrate this feature to attract more visitors looking for the best rates. Airlines employ the technology to forecast rates of competitors and adjust their pricing strategies accordingly.
Factors impacting flight prices..
A passenger-side predictor proposed by an OTA suggests the best time to buy a ticket so that travelers can make informed decisions. Carriers, on their end, try to find out the optimal price they should set to maximize revenue while remaining competitive.In both cases, the task is quite challenging because numerous internal and external factors influence airfares.
Internal factors include
- purchase and departure dates,
- seasonality,
- holidays,
- the number of available airlines and flights,
- fare class,
- the current market demand, and
- flight distance.
- concerts,
- sports competitions,
- festivals,
- terrorist attacks,
- natural disasters,
- political gatherings,
- epidemic outbursts, and
- economic activities.
Preparing airfare datasets
As with any ML task, it all starts with data. Its quantity and quality determine failure or success. Read our article Preparing Your Dataset for Machine Learning to avoid common mistakes and handle your information properly or check our 14-minute video to learn how data is prepated for ML.
Data preparation in a nutshell
This time, we’ll focus on a narrower task of finding and organizing airfare-related features.Popular flight data sources
To build an accurate model for price forecasting, we need historical data on flights and fares. “In view of seasonality, it’s better to have information collected over several years," explains Alexander Konduforov, Data Science Competence Leader at AltexSoft, "But you can start with data for several months.” The question is: where to get it? Here are several popular options.A search engine of your own travel platform. If you are an OTA or travel platform, you can use your own search engine as a source of information. When developing a price predictor feature for Fareboom, AltexSoft tapped into millions of queries made by the website visitors.
ATPCO. The Airline Tariff Publishing Company, ATPCO for short, keeps over 211 million fares from 440 airlines in its database. You may try to reach these treasures via Bridge Lab APIs. They are meant to enable tech startups and innovators to explore up to 14 months' worth of historical data.
Travel Insight by Skyscanner. Travel Insight is a data product of the Scotland-based metasearch engine and OTA that aggregates search queries from 100 million Skyscanner users monthly. You have three options to get access to this information.
- Downloading daily reports in CSV format saved on your secure FTP server or Amazon S3 bucket.
- Via the Aggregation API, on demand. It instantly returns data on searches of a particular itinerary within a certain time interval (30 days by default.) You can apply filters (up to 11 per query) to specify the information you are looking for; and
- Via your own online portal, using Travel Insight Vision feature.
Public datasets. There are also free datasets — for instance, Flight Fare Prediction on Kaggle. Yet, they are few in number, small, and may lack features required for your ML project. You can learn more about the best public datasets from our dedicated article.
Flight dataset structure
To get an idea of how to structure data for airfare prediction, let’s take a look at the above-mentioned Kaggle’s training dataset, which contains over 10,000 records about flights executed between March and June 2019. Information is arranged in chronological order and includes numerous factors that can impact the price behavior such as- the operating airline,
- date of journey,
- city of departure,
- destination,
- route, and
- departure and arrival time.

The section of the Kaggle dataset.
We used even more features to train our price predictor for Fareboom. Among characteristics that can be relevant to price, formation are the length of stay for round trips, number of competitors in the route, date and time of booking, days/hours left before takeoff, week day of departure, and more.Data gaps
The key problem we faced with fare data was the lack of information about certain routes on certain dates. Say, resorts may see small demand during the low seasons, so the volume of searches is not large enough to build predictions. To fill these gaps, we took information about neighbor travel dates and more popular destinations and applied advanced merging algorithms.As a result, we obtained consistent data sequences — or time series — suitable for further analysis.
Time series forecasting of ticket prices
Fare prediction is a classical problem of time series forecasting that finds trends in past observations and outlines the future based on the assumption that at a certain point “history repeats itself.” Yet classical doesn’t mean simple. As we've already mentioned, air prices are sensitive to numerous factors, which makes the task too tough to be solved with simple methods.Different machine learning algorithms and their combinations are applied to achieve a satisfactory level of prediction accuracy. Our data science team eventually went with the Light Gradient Boosting Machine or LightGBM. Now, a few years later, we would probably try other, newer techniques. But prior to discussing up-to-date advancements, let’s first do justice to fare forecasting pioneers.
RIPPER and Q-learning: how it all started
In 2003, Ph.D. in computer science Oren Etzioni introduced a model recommending whether to buy a ticket on a certain flight now or to postpone the purchase. It also suggested the best time for the booking. The model combines time series analysis with- RIPPER (Repeated Incremental Pruning to Produce Error Reduction) algorithm that extracts rules from a training set for classifying each flight query as buy or wait; and
- Q-learning, a reinforcement learning algorithm that chooses the next action — buy or wait — in view of the expected reward (in this case, discount factor).
Unfortunately, the feature was discarded in 2014. Yet, other travel retailers had already picked up the idea and launched similar tools with other algorithms under the hood. Among working predictors you can explore are Price graph on Google Flights, Price trends on Kiwi.com, and Price Predictor on Fareboom.
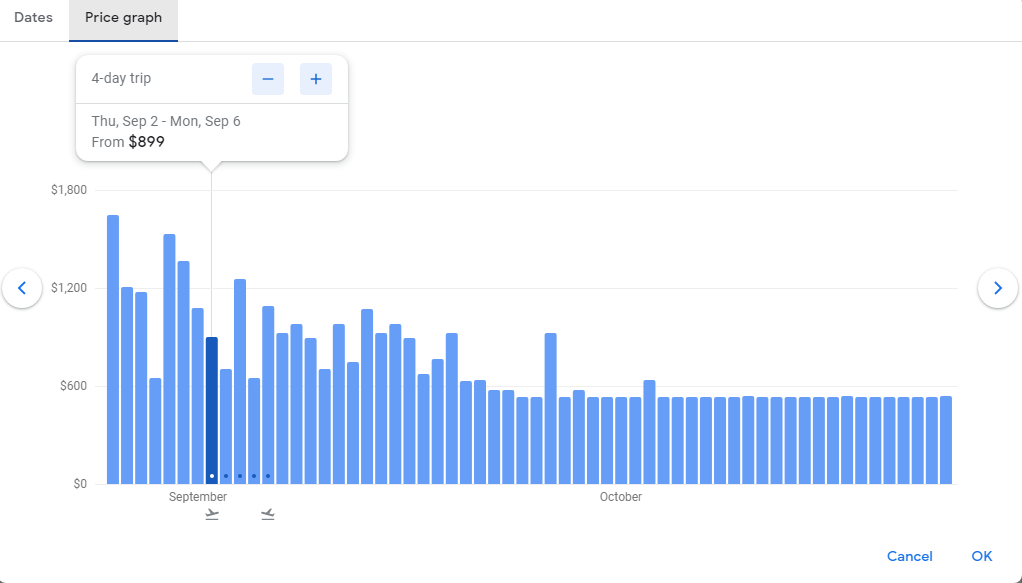
Google’s Price graph shows how airfare on a certain flight will change through September and October.
ARIMA: following the trodden path
When we started working on the predictor for Fareboom, autoregressive integrated moving average or ARIMA was commonly used to forecast airline prices. An oldie but goldie, ARIMA incorporates time-filtering methods developed back in the 1930-1940s for the needs of electrical engineering. In the 1970s, it found its application in business and economic forecasting, and since then the approach has been a popular way to predict time series.As the name suggests, ARIMA takes advantage of two simple yet robust techniques:
- an autoregression (AR), based on the idea that the current values in the series linearly and strongly depend on those in the past. So, it calculates future events taking previous outcomes as an input; and
- a moving average (MA) focusing on the dependencies of future events from past errors.
LightGBM: betting on the winner
In fact, there is nothing totally new in the world of calculations. LightGBM is just an advanced version of a time-honored Gradient Boosting Decision Tree (GBDT) algorithm. Here, a decision tree predicts the outcomes of certain choices, with each branch representing an available decision and its possible result.GBDT trains a number of decision trees, one by one, and every next iteration considers the errors of the previous and boosts or improves the accuracy. Finally, the model combines the outcomes of each tree to generate a prediction. LightGBM uses the same approach — except for the fact that it grows trees leaf-wise, not depth- or level-wise, as it was with the previous gradient boosting algorithms.
The picture below clearly shows the difference between the two strategies. Level-wise growth means that every decision node or leaf splits into possible outcomes, no matter its validity. This results in redundancy and calculation of non-informative or erratic branches. On the contrary, leaf-wise algorithms find the node with the highest information gain and focus on the winner.

Level-wise tree growth strategy vs leaf-wise tree growth strategy.
What does it mean in practice? A lot of great things — like better performance, higher accuracy and speed, and less memory required. Yet, all these benefits make sense if you have enough data, as LightGBM doesn’t work for small datasets. As for our case, with the novelty approach, we achieved an average accuracy of 75 percent.We trained two separate models to make short-term (7 days) and long-term (7 weeks) forecasts. Initially created with R programming language, they were translated to C# to comply with the core platform. But before going into production, our double-purpose predictor required a relevant wrapping.
Converting algorithms into a user-friendly tool
The old saying encourages us not to judge the book by its cover. But people hardly mind it when facing the clunky UI. To make the new tool convenient for users, our UX/UI designer and software engineers created a simple pop-up module. The prediction takes the form of an informative line chart showing how the price is expected to change over time.
Fareboom Price Predictor module.
The predictor also makes straightforward recommendations on the best date to purchase the flight. If it’s not today, visitors can subscribe to price drop alerts and receive the latest updates via email or directly to their phone.A month after the tool was integrated, the average time that visitors spent on Fareboom doubled. With these achievements in mind, let’s see what can be improved.
Recurrent neural networks: new opportunities for solving old problems
In recent years, more powerful models have been widely adopted for time series problems. Though ARIMA or decision tree ensembles do a good job, competing technologies are here to offer impressive results. One of the big stars on the current forecasting landscape is a Long Short Term Memory (LSTM) architecture. And we would obviously give it a try if we faced the task of price prediction today.LSTM is a representative of the Recurrent Neural Networks (RNNs), lying behind Google Translate and virtual assistants like Amazon Alexa The main appeal of RNN models is the ability to remember previous inputs and use them to produce the forecast. But, unfortunately, this internal memory spans short terms only. In other words, RNNs “forget” what happened several inputs before and therefore fail to work with long data sequences.
This is the reason why LSTM appeared at all. The architecture сomplemented vanilla RNN with the long-term memory along with the power to decide whether to keep a certain feature in memory or delete it. Yet, LSTM is not without disadvantages. As with any other deep learning model, it requires tons of data and a great deal of tuning to work well.
Train, test, and try again
COVID-19 changed travel patterns and affected the accuracy of existing prediction tools. So, even if you are not going to implement new models, it’s highly recommended to retrain existing ones on new, more relevant data.As for OTAs and airlines which are only trying the idea of price prediction for size, the main message we want to share with them is as follows. There is no one-size-fits-all algorithm. The choice will heavily depend on the dataset size, the number of features considered, the period to be forecast, and available computation resources, to name just a few factors. Anyway, it’s all about experimentation and learning from previous records of highs and lows.